Key Takeaways
Are "Conversion Killers" lurking on your landing pages? To hit the jackpot with a 4x ROAS, you need to see what your customers see. This Heatmap Hotshot Guide reveals how to turn silent user behavior into actionable insights. From fixing frustrating rage clicks to optimizing scroll depth, learn the visual superpowers you need to stop wasting ad spend and start scaling your D2C brand with confidence.
Landing Page Heatmap Hotshot Guide
This guide explains how to use heatmaps to understand user behavior on D2C landing pages and improve conversion rates without requiring a data science degree.
I. Introduction: Understanding User Behavior for Conversions
- Problem: Landing pages may have low conversion rates despite good copy and visuals, making it difficult to identify why visitors aren't engaging.
- Solution: Heatmaps visualize user interaction (clicks, scrolls, hesitations) on D2C landing pages, translating silent behavior into actionable insights.
- Benefit: Enables data-backed decisions and informed strategy by transforming anecdotal observations into clear patterns.
II. History of Heatmaps
- 1873: The concept of using colors to represent data originated with a French statistician mapping Parisian social statistics by hand.
- Late 1800s: Scientists studied eye movements during reading, leading to early eye-tracking devices focused on identifying where people look.
- 1990s: Computer-generated heatmaps were trademarked for financial data, and high-resolution cluster heatmaps emerged.
- Circa 2005: The convergence of statistical representation, behavioral science, and digital technology led to modern web heatmaps showing click locations and areas of user attention.
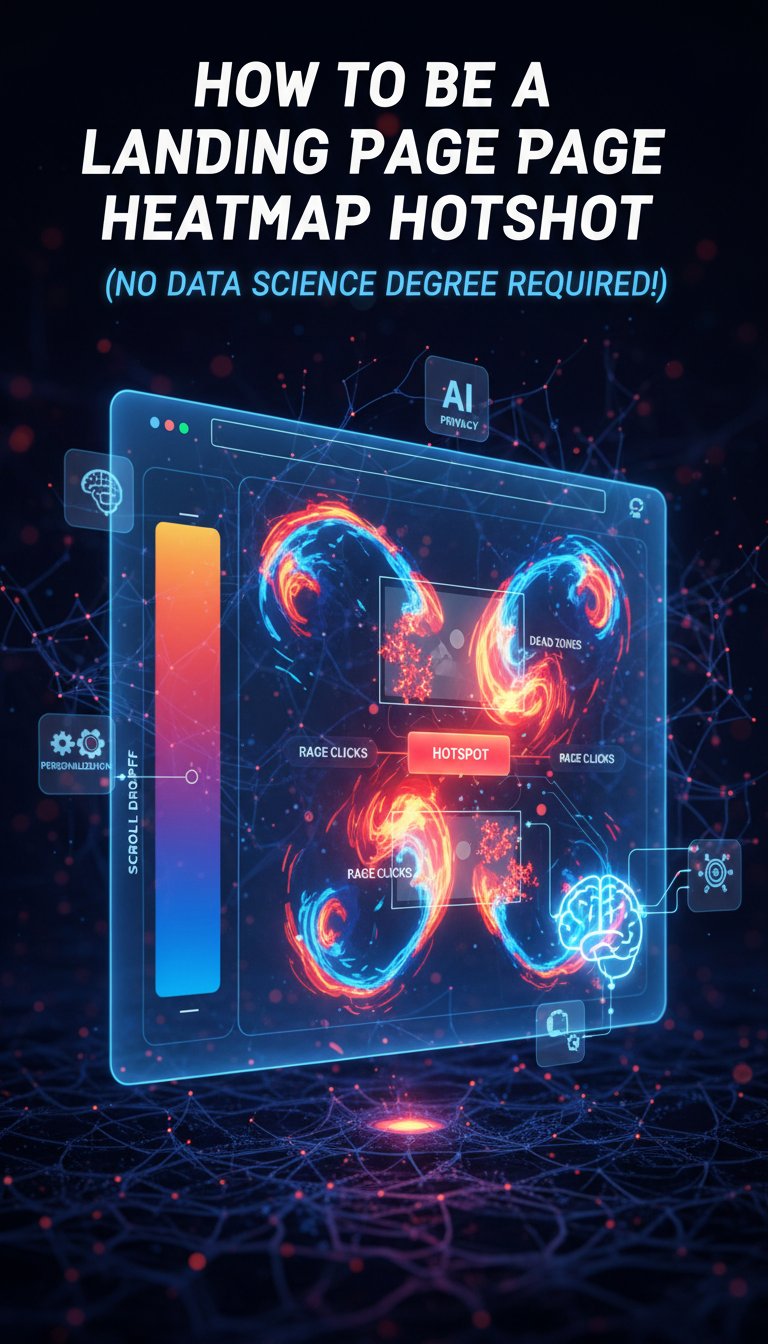
III. Decoding Heatmap Visuals and Key Patterns
Color Coding
Hot colors (red/orange) indicate high activity; cool colors (blue/grey) indicate low activity.
Types of Heatmaps:
- Click Heatmaps: Show where users tap or click.
- Scroll Heatmaps: Reveal how far users scroll down a page before leaving.
- Move/Hover Heatmaps: Track cursor or finger movement, indicating areas of interest or confusion.
"Big 4" Conversion Killers and How to Identify Them:
A. Rage Clicks:
- What it is: Clusters of repeated clicks on elements that appear clickable but are not interactive.
- Meaning: User confusion, frustration, and potential for abandonment.
- Fix: Make non-interactive elements visually distinct or convert them into interactive elements. Example: Harrods reduced abandonment by fixing rage clicks on their checkout form caused by blocked special characters.
B. Dead Zones & Dead Clicks:
- What it is: Large areas of the page with no user interaction (dead zones) or single clicks on elements that do nothing (dead clicks).
- Meaning: Content is not engaging, or elements are broken, leading to lost attention and potential conversions.
- Fix: Relocate critical elements, break up dense content, remove ineffective content, and redesign the layout.
C. Ignored Sections & Scroll Drop-Off:
- What it is: Scroll heatmaps show a rapid fade to blue, indicating users leave before reaching important content or calls-to-action (CTAs) located too low on the page.
- Meaning: Key information and offers are buried and unseen.
- Fix: Move primary CTAs and core offers "above the fold" or higher up the page, and consider techniques like sticky navigation or progress indicators.
D. Hotspots in the Wrong Places:
- What it is: High user activity on non-essential elements (e.g., logo, "About Us") while primary CTAs are ignored.
- Meaning: Visual hierarchy is misaligned, and design elements distract from the main conversion goal.
- Fix: Reduce distractions, enhance the visibility of the main CTA, and re-evaluate the visual weight of page elements.
IV. Current Debates and Data Dilemmas
Upside:
Heatmaps are valuable for non-data scientists and are highly effective when combined with session recordings for a richer understanding of user behavior.
Downsides & Challenges:
- Dynamic Page Drama: Animated or pop-up-heavy pages can create complex heatmap patterns requiring careful analysis of interactive elements.
- Resolution Riddle: Data can be siloed across different screen sizes and resolutions, necessitating segmentation by device type and screen size for accurate analysis.
- Over-Simplification Trap: Colors can obscure nuances, and subjective judgments might appear objective; always consider context and supplement with other data sources.
- Privacy Concerns: Session recordings and eye-tracking data can capture sensitive personal information. Compliance with regulations like GDPR and CCPA requires explicit consent and robust data security.
- Mouse vs. Mind-Reading: Mouse movements are an interpretation of attention, not a direct measure of where eyes are looking, with correlations sometimes as low as 69%.
V. Weekly Heatmap Detective Routine (30 Minutes)
- Select Patient: Choose high-traffic, high-value pages over a few days to gather reliable patterns.
- Check Scroll Depth: Assess if users are reaching the main offer and adjust content placement if necessary.
- Scan Clicks: Identify and investigate clicks on non-interactive elements.
- Prioritize Rage Clicks: Address these frustration zones immediately as they are significant conversion killers. (Example: Derek Rose increased conversions by 37% by tackling rage clicks.)
- Test Hypotheses: Use heatmap insights to form hypotheses and A/B test changes for iterative optimization.
VI. The Future of Heatmaps: AI, Personalization, and Ethical Tech
- AI Integration: AI is already analyzing sessions, flagging rage clicks, and predicting user interaction with designs before launch.
- Proactive & Predictive: Heatmaps will dynamically adjust landing page layouts in real-time based on predicted user intent.
- Hyper-Personalization: Tailoring experiences to individual users with custom content, adapted layouts, and behavior-based recommendations.
- Automated Solutions: AI will identify root causes of problems and suggest or implement solutions.
- Ethical Frontier: Continued focus on ethical AI, transparent data usage, and robust privacy controls.
- Fully Integrated: Heatmap insights will seamlessly integrate into marketing and product ecosystems, creating a smarter customer journey.
VII. Conclusion: Heatmaps for D2C Success
Heatmaps are a powerful and accessible tool for D2C teams to understand user behavior. By mastering key patterns and adopting an iterative approach, teams can convert user frustration into customer satisfaction and significantly boost conversions. Heatmaps offer a visual superpower to unlock landing page potential by moving from guesswork to data-driven insights.
Share this article
Help others discover this content